Ganglia Feeder - gs_gmetad
GroveStreams has built a feeder that uploads metrics collected from
Ganglia, a free scalable distributed monitoring
system for high -performance computing systems such as clusters and
grids. Ganglia is used to gather common computer metrics such as
memory, disk, cpu usages along with optional Hadoop and Hbase
metrics. This tutorial will walk you through the installation and configuration of the gs_gmetad GroveStreams feeder.
Collecting metrics from you cluster is easy with GroveStreams and Ganglia. You just need to:
- Install and configure a Ganglia gmond daemon on each of your servers
- Install and configure the GroveStreams gs_gmetad daemon feeder on one or more servers to upload Ganglia gathered metrics into GroveStreams
- Create a GroveStreams user account and an organization based on the GroveStreams Ganglia blueprint. The Ganglia blueprint contains pre-defined units, reports, events and notifications - all of the items needed to get up and running quickly.
The GroveStreams gs_gmetad project includes all of its source files and is licensed under the Apache 2.0 license.
Step 1: Install and Configure Ganglia
This component is dependent on Ganglia which is free to use and is a
BSD-licensed open-source project. The GroveStreams gs_gmetad feeder runs as a Linux daemon and replaces Ganglia's gmetad daemon.
Install the Ganglia gmond daemon on each of the servers to be monitored. Install gs_gmetad on the server that Ganglia's gmetad daemon typically runs on. You can visit the Ganglia website for information on installing and configuring Ganglia but here is the short version for what you need to do (commands below are for Ubuntu Linux servers):
- Install Ganglia on each of the servers you want to monitor
- $sudo apt-get install ganglia-monitor gmetad
- Configure gmond.conf on each of the monitored servers
- $sudo nano /etc/ganglia/gmond.conf
- Make appropriate changes per Ganglia's instructions. For our cluster we have the following settings on each of our servers:
- globals {
daemonize = yes
setuid = yes
user = our_user_account_name
debug_level = 0
max_udp_msg_len = 1472
mute = no
deaf = no
host_dmax = 86400 /*secs */
cleanup_threshold = 300 /*secs */
gexec = no
send_metadata_interval = 300
allow_extra_data = true
} - cluster {
name = "Store Servers"
owner = "unspecified"
latlong = "unspecified"
url = "unspecified"
} - The cluster name will be placed in your component's description field.
- GroveStreams will attempt to use latlong to place your component within a map.
- Owner and url are ignored.
- host {
location = "Servers"
} - GroveStreams will use the host { location = "Servers" } attribute to determine the folder the server will appear within GroveStreams. Hierarchies are respected (i.e. location = "Servers/Web Servers")
- Hint: You should organize your servers into folders of 100 or less servers. This makes reporting much easier as you can create dashboards by selecting folders (via Stream Groups). Some dashboard widgets do not work well with more than 100 streams.
- udp_send_channel {
#mcast_join = xxx.x.xx.xx
host = server1.corp.grovestreams.com
port = 8649
ttl = 1
} - Configure udp_send_channel to point to the server running gs_gmetad
- udp_recv_channel {
#mcast_join = xxx.x.xx.xx
port = 8649
#bind = 239.2.11.71
} - Start Ganglia on each server
- $sudo /etc/init.d/ganglia-monitor restart
Step 2: Download and Build gs_gmetad
gs_gmetad runs as a java Linux daemon and requires that its jar library be built on the operating system it will run on. This section describes how to build the jar file.
Apache Ant is required to build the gs_gmetad project. Install ant:

A Java jdk is required to build gs_gmetad. If one is not present then you will need to install one:

Use Ant to build gs_gmetad:

If you haven't done so already, create a GroveStreams user account.
Log into your GroveStreams account and create a new organization while selecting the Ganglia system blueprint. Enter your new organization.
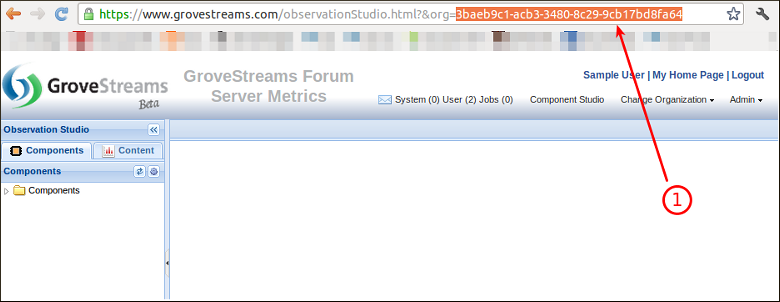
You will need your organization's universal identifier (uid) and an API secret key to configure gs_gmetad.
(1) You can obtain your organizations uid from your organization's observation studio url:
Create a new API key for gs_gmetad or use the key that was created when the Ganglia blueprint was imported.
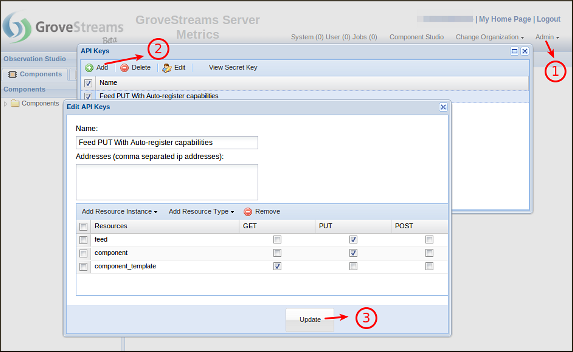
Creating a new key:
The key below will have rights to automatically register new components as they upload their metrics. gs_gmetad requires these rights. You can secure your key even more by including the IP address of the server running gs_gmetad as part of the API key configuration. Not listing any IP addresses allows the key to be used from any server.
(1) Select Admin - API Keys
(2) Click Add
(3) Create a key with settings similar to the one below and click Update
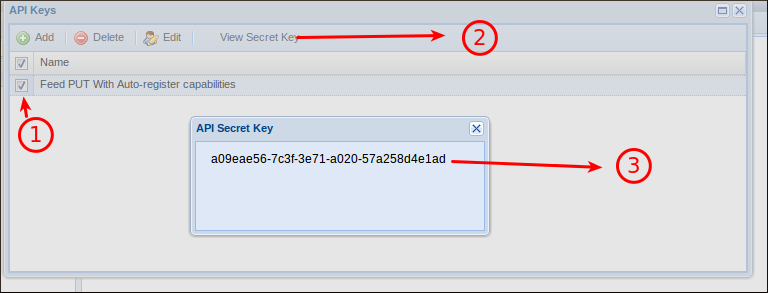
(1) Select your key
(2) Click View Secret Key
(3) This is the key you will need when you configure gs_gmetad below. Select the key with your mouse and copy it to the clipboard (Ctrl-C).
Step 3: Configure gs_gmetad
You may need several servers running gs_gmetad if you have a large cluster. The rule of thumb is to monitor the gs_gmetad log to determine how long uploads are taking. If they take more than five seconds, then you should use more gs_gmetad servers to break the upload work into smaller amounts.
Edit gs_gmetad.properties:

(1) Set RETRIEVE_FROM_HOST and PORT to the gmond server gathering Ganglia metrics
(2) Set your GroveStreams upload information. You can choose to use http or https (SSL). http will have a better response time but will be less secure.
(3) Set your organization UID that was identified in Step 2 above
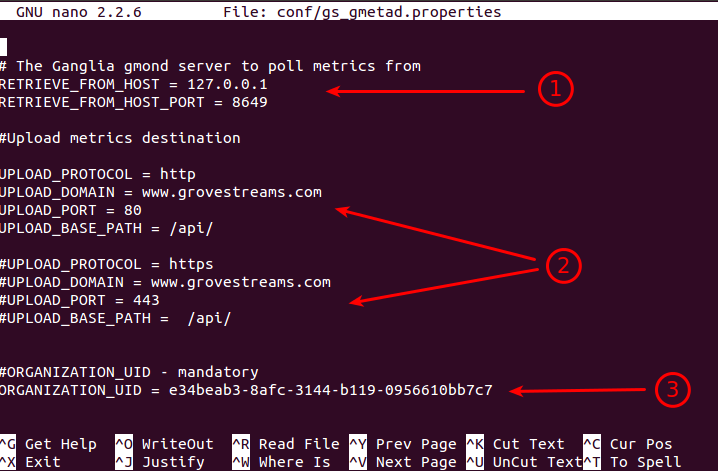
(1) Set your secret api key that was also identified in Step 2 above
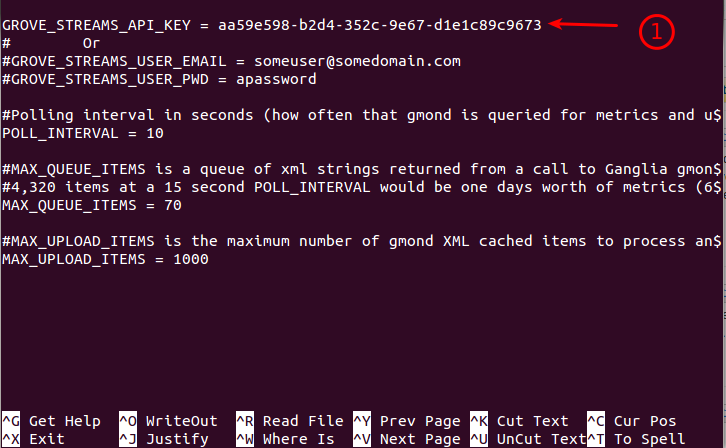
Save and close gs_gmetad.properties
The configuration file also contains settings to filter which metrics get uploaded into GroveStreams. Without these settings, Ganglia may upload thousands of metrics per server, many of which, you don't care about but will add to your usage costs and create UI performance issues. Fine tune these settings to only allow for the metrics you wish to monitor:
EXCLUDE_METRICS = hbase.RegionServerDynamicStatistics,metricssystem.MetricsSystem,rpc.metrics
INCLUDE_METRICS = rpc.metrics.get_avg_time, rpc.metrics.exists_avg_time, rpc.metrics.put_avg_time,rpc.increment_avg_time
gs_gmetad interrogates these setting in this order:
- If a INCLUDE_METRICS item listed is a substring of the reported metric name, then include it
- If a EXCLUDE_METRICS item listed is a substring of the reported metric name, then exclude it
Edit gs_gmetad.sh

(1) Set JAVA_HOME to point to your preferred jvm. Change SERVICE_USER and GROUP to the user and group that the daemon will run as when it starts automatically.
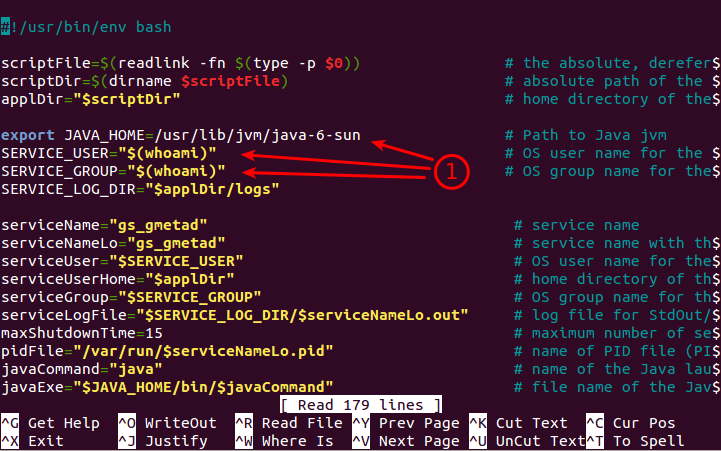
Close and save gs_gmetad.sh.
Install gs_gmetad by running the following command so that it starts automatically during server bootup:

Step 4: Run gs_gmetad
Run the following command to start the daemon now:

When gs_gmetad is properly gathering service metrics, it will automatically create a new component for each server in your cluster and place the component in the root directory (1) or under the directory you specified above in the gmond.conf location attribute. Click the refresh button to see newly registered components (1). You can safely move the component to another directory at any time.
Expand a component and double click one of its streams to see the stream's latest metrics (2).
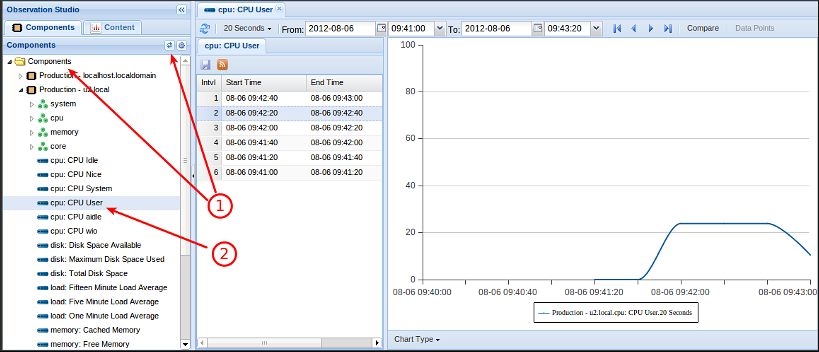
Once your servers are registered as components in GroveStreams you can create dashboards and set alerts.
To create a dashboard:
- Click on the Dashboard tab within your organization's
observation studio
- Right click a folder and choose New - Dashboard and give
it a name
- Choose Add Content and add one or more widgets
- Drag and Drop streams onto your new dashboard widgets
- Save your dashboard
Tips:
- Rename your server names. Depending on how you have your domain setup, Ganglia may return the ip address or a long domain name for your servers. You can rename your servers to whatever name you desire. Just don't change the ID value as that is what links a component to the data Ganglia uploads. Short names appear in charts better.
- The Ganglia blueprint contains a runnable that updates stream groups and aggregation streams (used for cluster metrics) every 15 minutes. Feel free to change this amount. Be away that new servers may not appear in existing charts for up to 15 minutes. Your will have to close and reopen your charts to pickup new servers.
- Stream Groups:
- For large clusters or clusters that have servers added or removed frequently, you should leverage the "Stream Groups" feature. Stream Groups allow you to select streams dynamically by folder and by stream id or name. You can have your dashboard widgets reference stream groups instead of specific streams. This allows for newly registered server metric streams to automatically appear in your dashboards. You will learn quickly that it is almost always better to use Stream Groups from within dashboards for all widgets that support them. To use Stream Groups:
- Right click in the component tree and select "Stream Groups". Select component folders that contain the streams you wish to report on. Set the ID of the stream you wish to include. The stream ID can be found by right-clicking on a component and choosing "Edit". Select the stream and look at its General tab for its ID. The ID is set by Ganglia. Do not change it.
- Save the Stream Group, select it and run "Update Stream Group Results Now". This will run the query and save the results that will be used when the Stream Group is referenced. You can now select the new Stream Group from many dashboard widgets.
- Updating the Stream Group manually can be tedious and you may forget to do it periodically as components are added or removed. You can create a "Runnable" and schedule it to run periodically to do this for you:
- Select Admin - Runnables
- Select New. Give it a name and select the schedule cycle. For small Stream Groups, 15 minutes is recommended. For large Stream Groups, a larger cycle should be used. Add your Stream Group to the list of Processes to run.
To setup an event with notifications
- Right click the component you want to setup an event for and choose Edit Component
- Right click on the Events folder and choose Add Event
- Configure your event for a specific stream and the appropriate actions to take for that event
- Click Save to save the changes to your component
Troubleshooting
gs_gmetad logging
gs_gmetad uses Apache Log4j for logging information while
running. View the logs in the gs_gmetad/logs directory for clues as
to why you might be experiencing problems. To change the level of
detail in the log, edit gs_gmetad/conf/log4j.properties (set
logging to INFO, WARN, DEBUG or TRACE) and restart gs_gmetad.
GroveStreams Organization System Notifications
GroveStreams System notifications are created whenever an error occurs on the server while processing organization API calls. Check your organization's system log for clues as to why you might be experiencing problems:
- Log into GroveStreams and select the home tab to see a
list of organizations along with a count of messages for each
organization. Click the button next to your organization to view
its GroveStreams notifications.

