Explore Pivot Grids
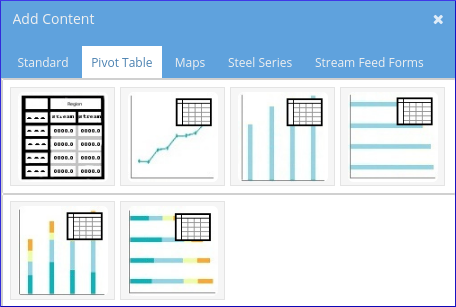
Dashboard pivot tables are a great way to allow users to see different views of stream data.Pivot Widget Selections:
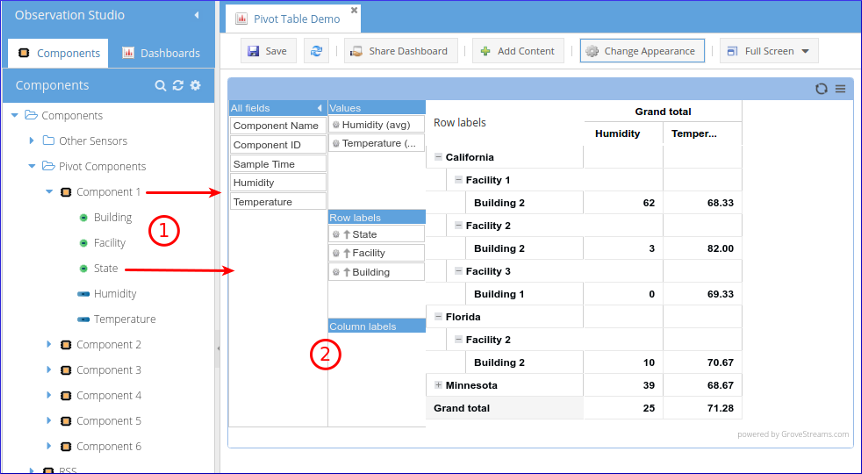
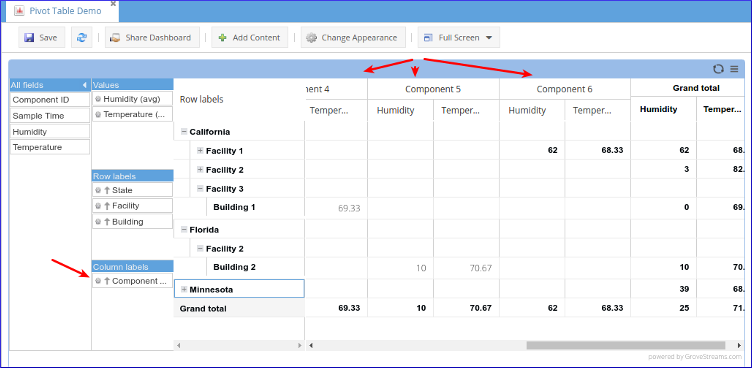
Adding Data: . Simply drag component and streams onto your table. Then select which streams are the rows, columns, and values.
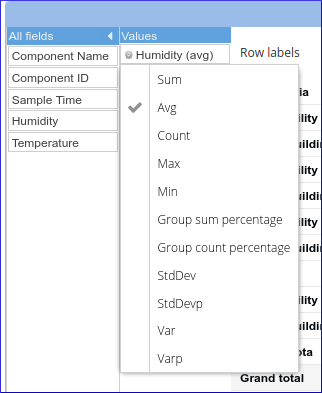
Value Total Calculation Options:
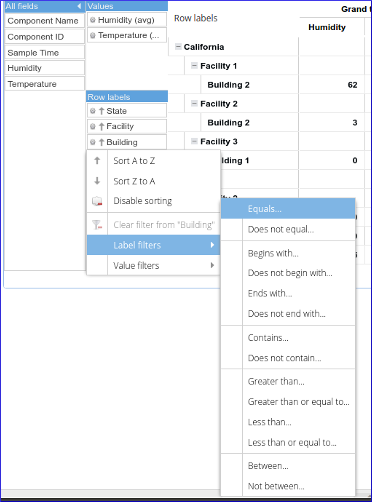
Label Filters:
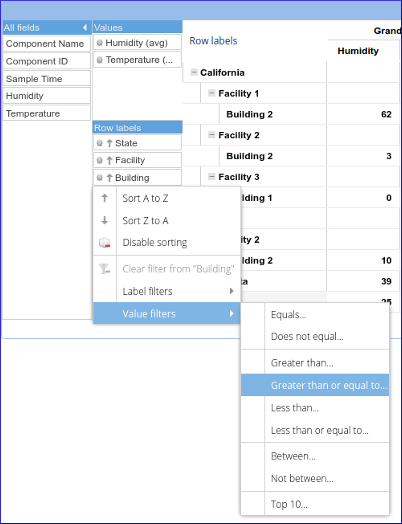
Value Filters:.
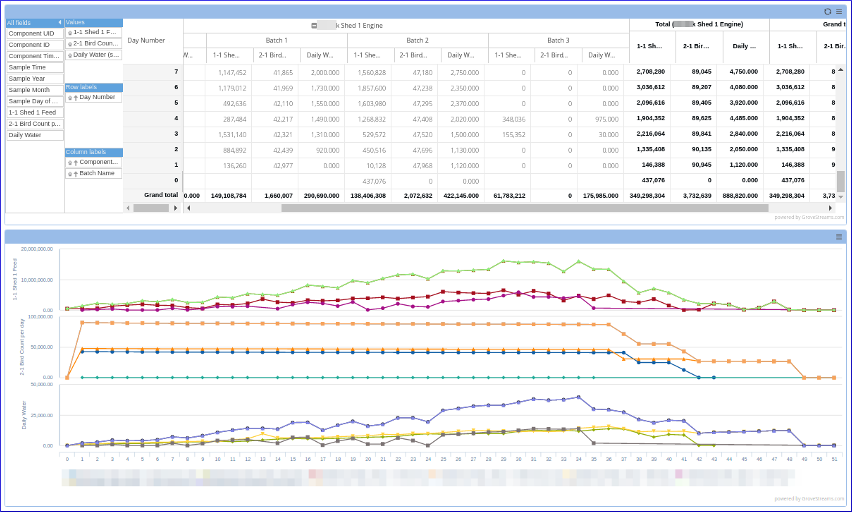
Dashboard with a Pivot Table: Dashboard pivot tables are a great way to allow users to see different views of stream data. Pivot tables allow data to be displayed as groups or in hierarchies while aggregating and displaying group sub-totals and grand-totals.
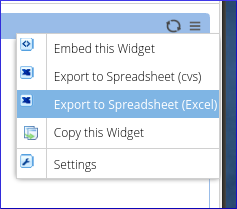
Export:
