Roll-ups compute statistics — time-weighted average, sum, count, min, max, gap count, and more — automatically as data arrives. Derived streams take it further: Excel-style formulas that reference other streams, roll-up statistics, and cross-component values to produce new computed streams in real time.
Real-Time Roll-ups
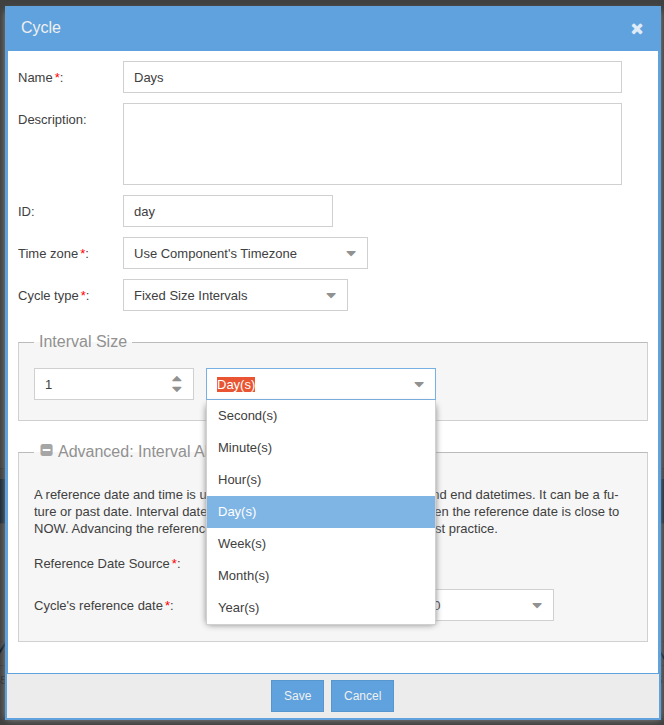
A roll-up calendar defines the cycles — 1 minute, 5 minutes, hours, days, months, years — that the engine maintains for every stream that references it. Each cycle is independently configurable (interval size, time zone, reference date). Statistics compute and store automatically as data arrives; queries read pre-computed values instead of scanning raw samples.
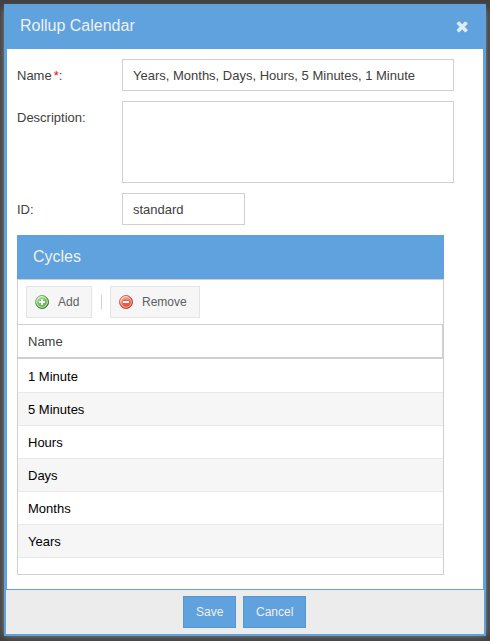
Pick a Cycle. Pick a Statistic. Done.
Anywhere a stream is referenced — charts, dashboards, derivations, GS SQL — you can request a specific roll-up cycle and statistic. The engine returns the pre-computed value: time-weighted average, sum, count, min, max, gap count, and more.
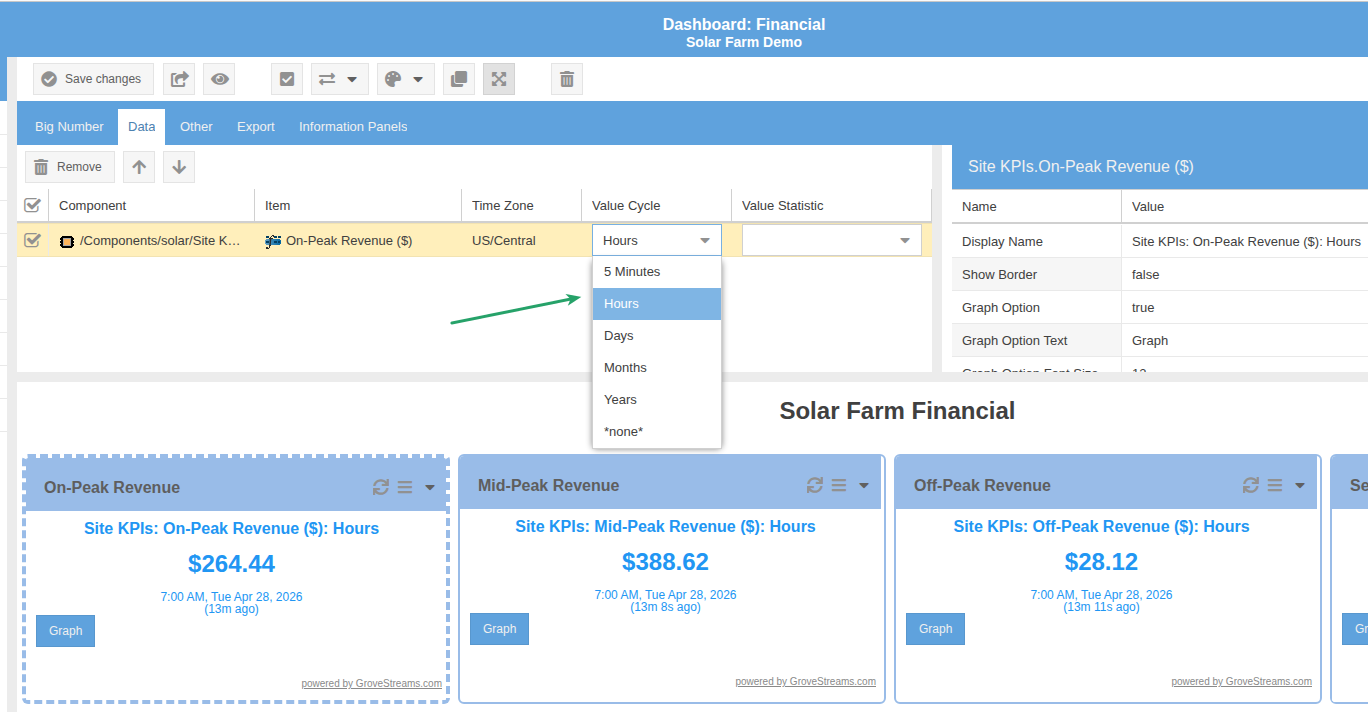
CycleId/Stat parameters.One Stream. Every Cycle. Live.
The same stream rendered four ways — hourly, daily, monthly, yearly — each widget pulling a different cycle and statistic from the same source. The roll-ups are pre-computed and refresh as new samples arrive; the dashboard just reads them.
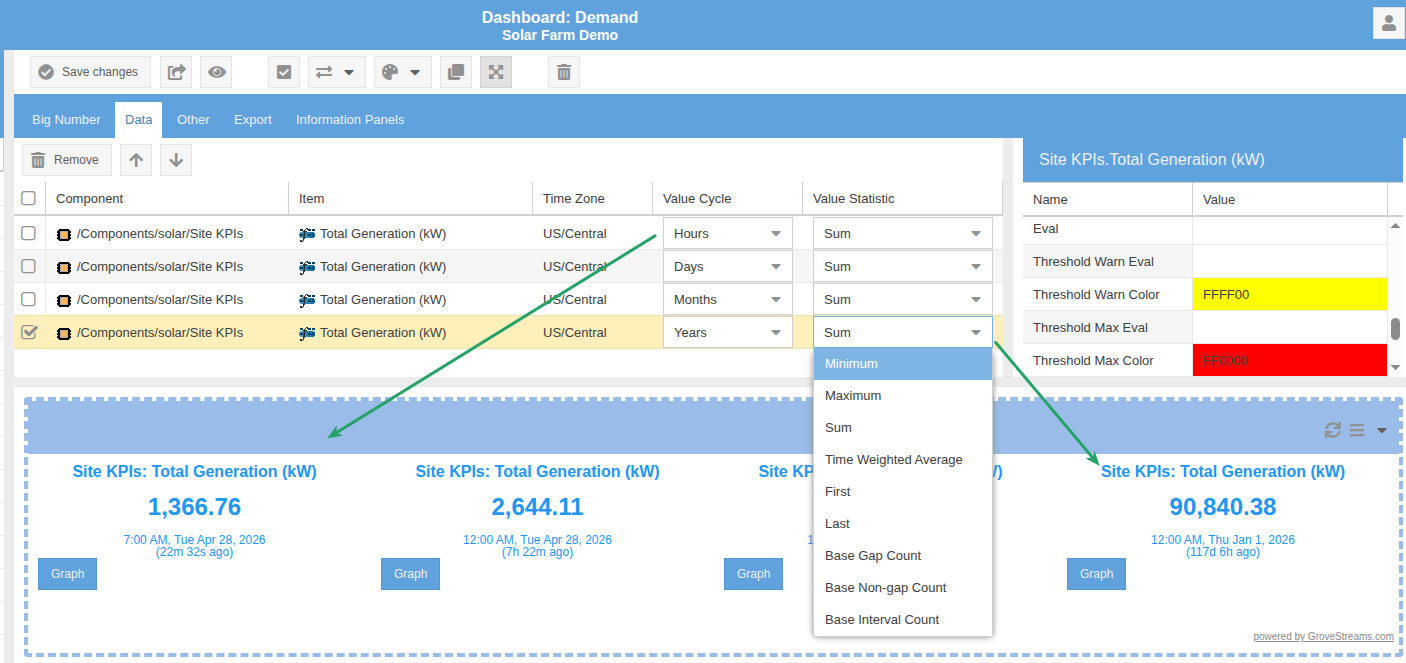
Site KPIs → Total Generation (kW) — rendered as four Big Number widgets at different cycles. The widget config (top) maps directly to the live values (bottom).Time Filters — Time of Day, Day of Week, Season
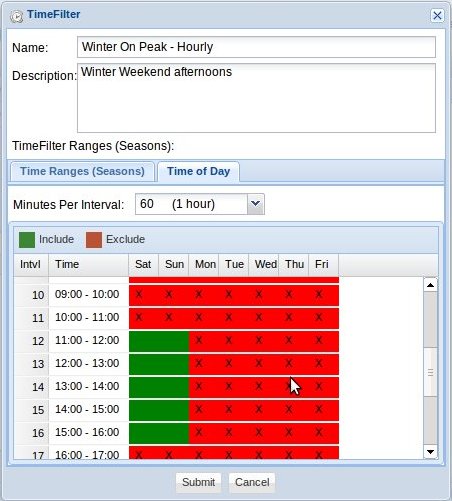
Time filters narrow a roll-up to specific slices of the calendar — time of day
(business hours, on-peak, off-peak), days of week (weekdays vs weekends), and even
seasons (e.g. Winter On-Peak for utility rate analysis). Configure them once
and reuse them anywhere a temporal window appears, including as parameters inside GS SQL
Range() clauses.
Temporal Alignment
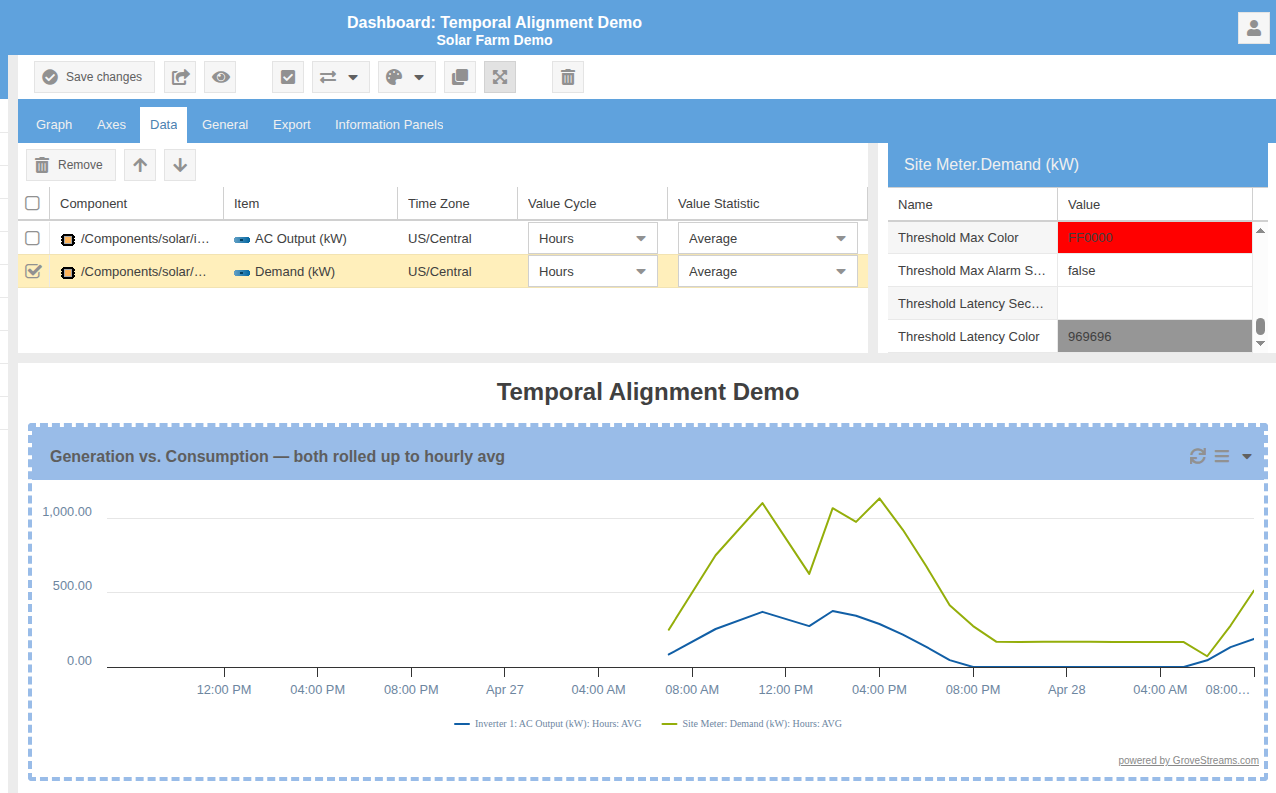
Each stream has its own independent time axis. Roll-ups project mismatched time axes onto a common temporal grid, enabling cross-stream correlation with simple equi-joins on entity identity and aligned timestamps.
Derived Streams
Write formulas like spreadsheet cells — they evaluate as data arrives and produce new streams that can be charted, queried, and used as inputs to further derivations.
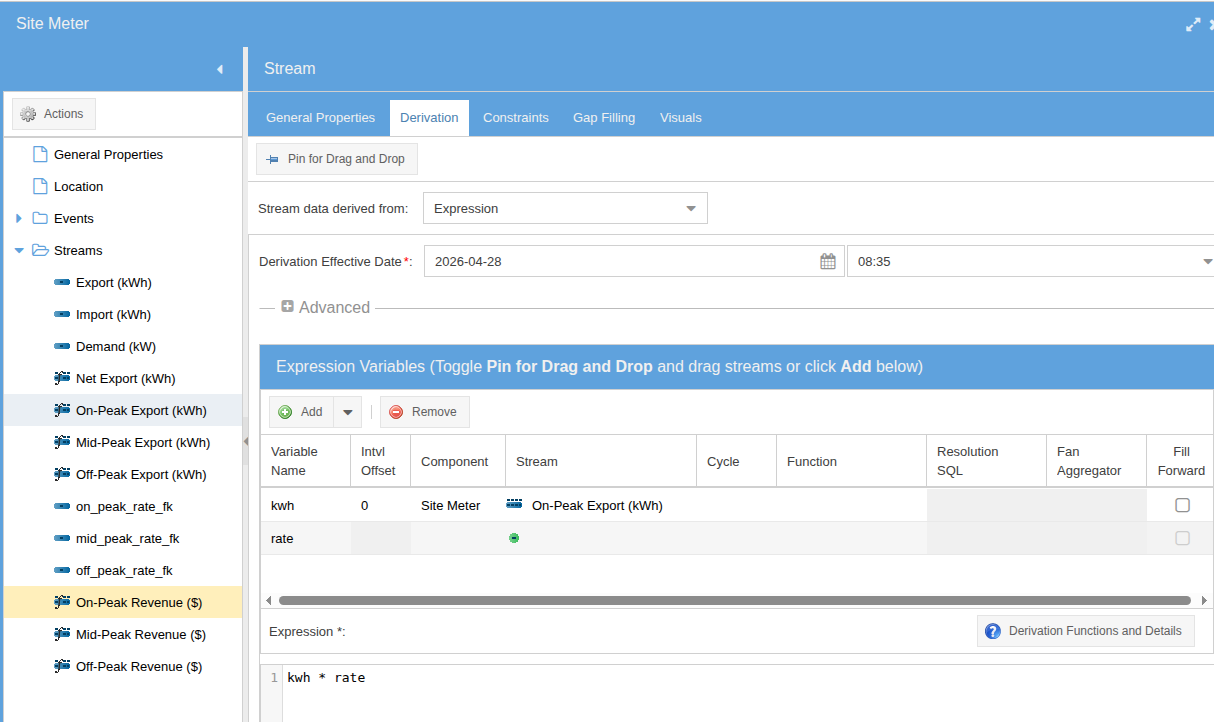
on_peak_rate_fk link to read the current on-peak rate and multiplies it by the metered export.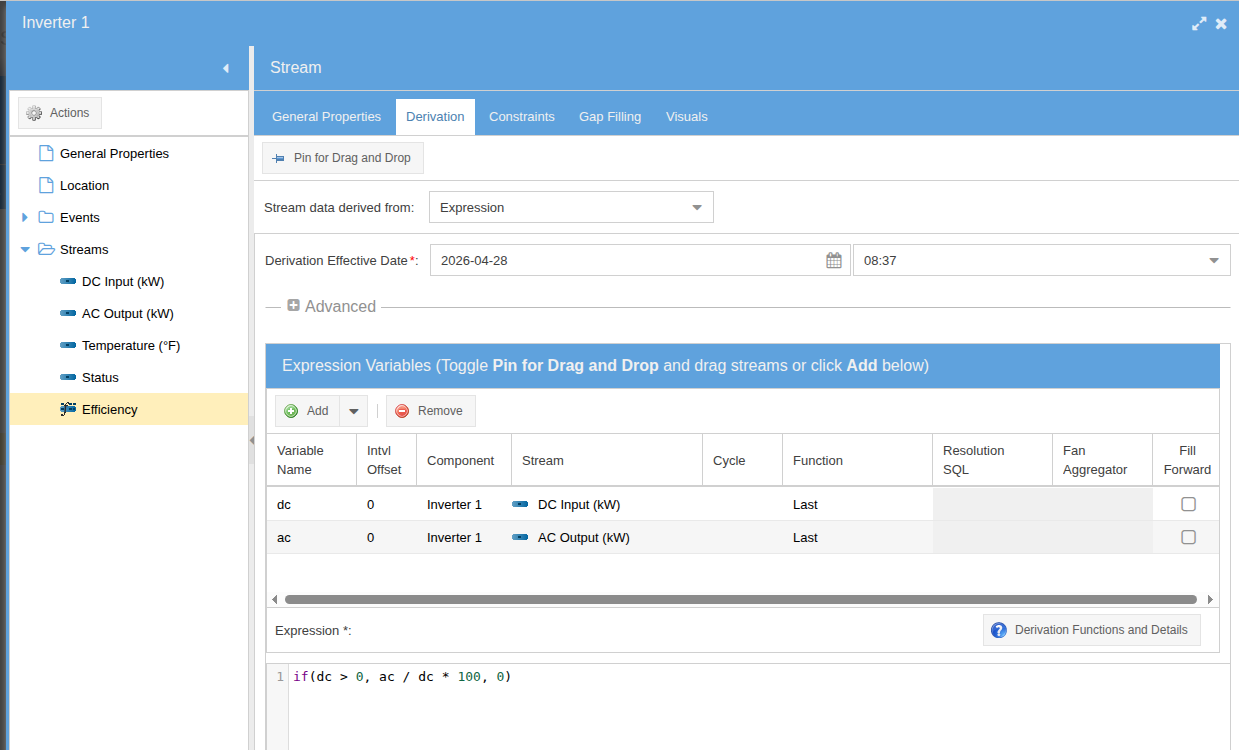
Both editors expose the same primitives: stream references, roll-up cycle & statistic selectors, and the full Excel-style function library. Pick a raw value, a TWA, an hourly sum, a daily max — the engine routes the request to the pre-computed roll-up.
Chained Derivations
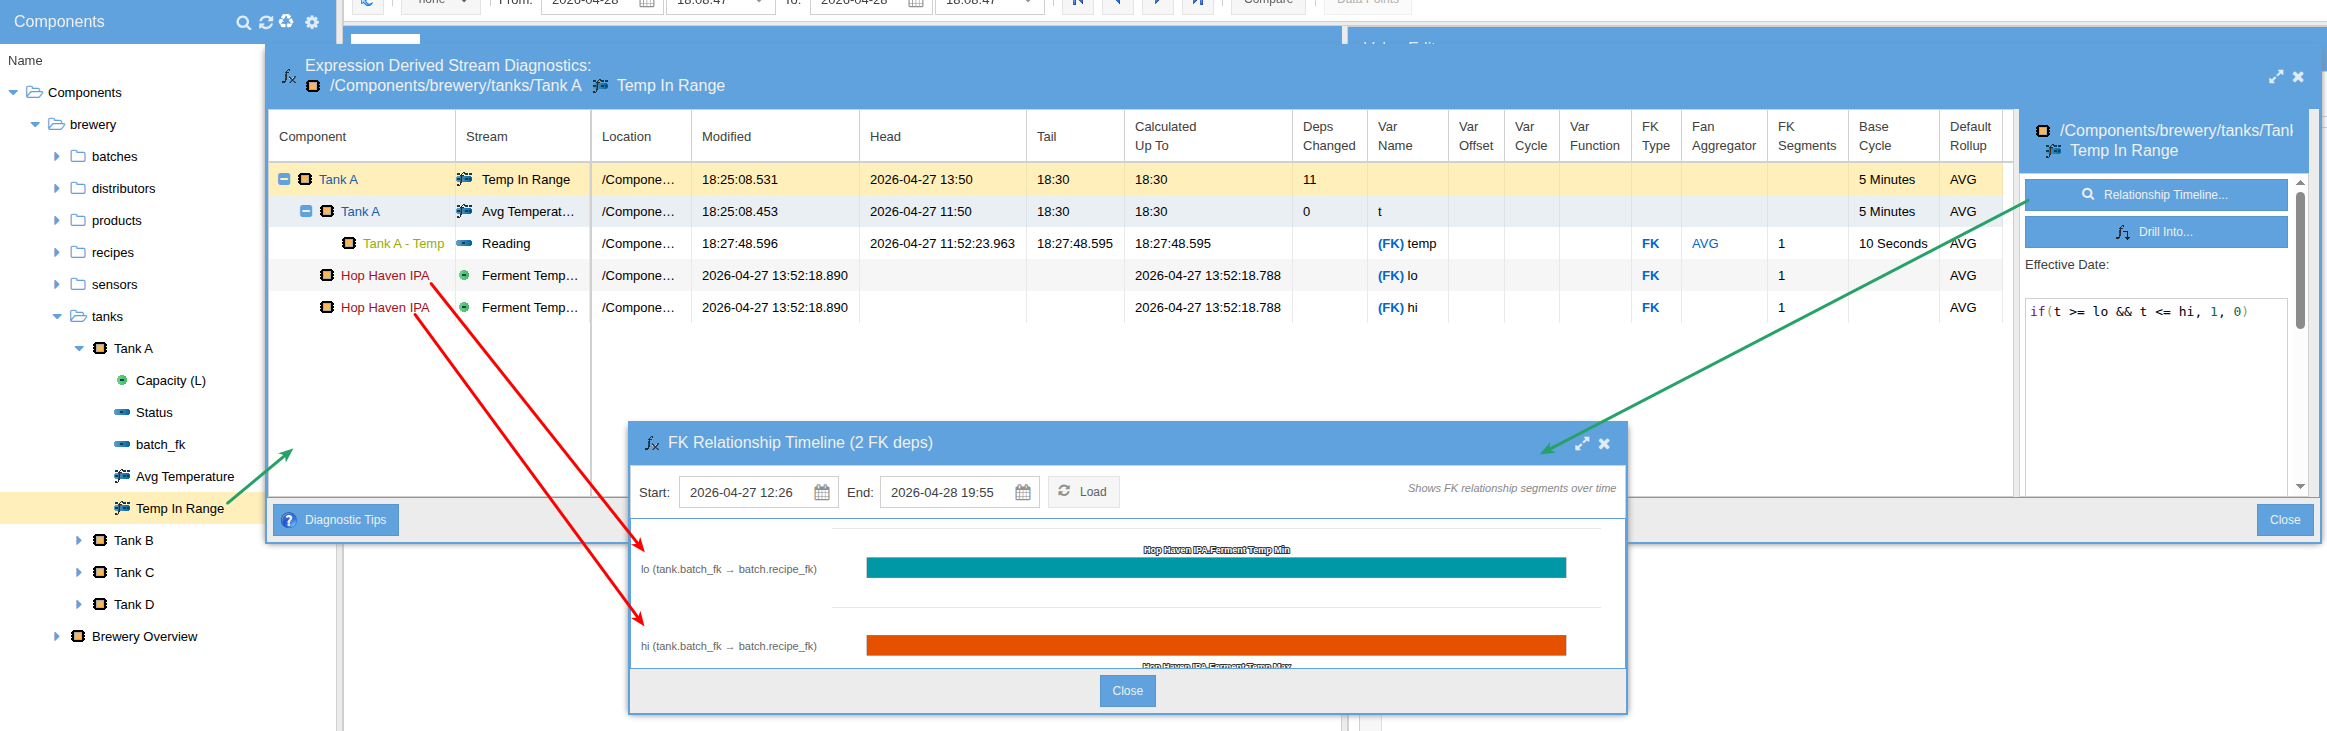
Derivations can chain across the schema. Inputs are GS SQL queries that follow link streams from one component to the next — a tank reads its current batch, the batch reads its recipe, the recipe supplies the high and low temperature targets. When the tank is reassigned to a new batch, the derivation automatically picks up the new recipe's targets — no code change, no pipeline rebuild.
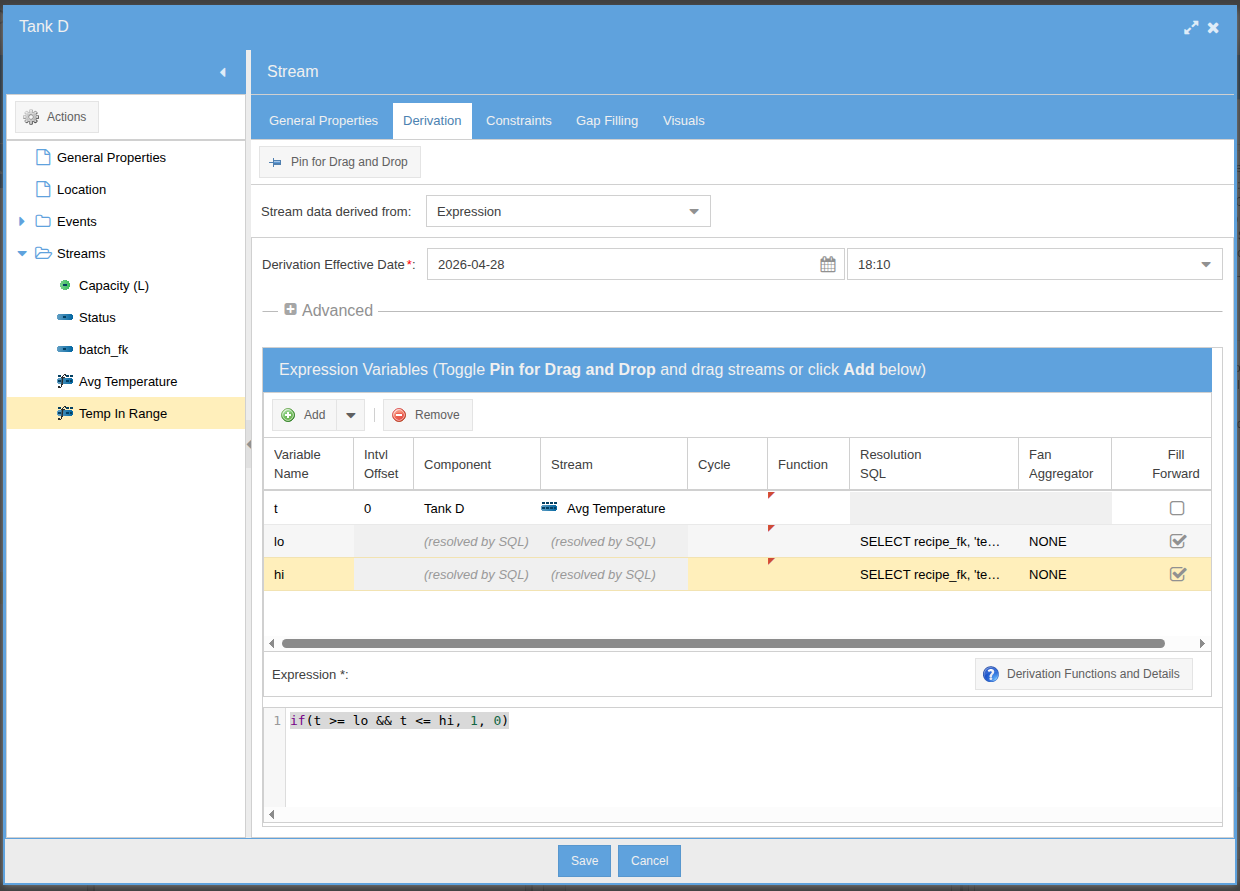
temp_in_range derivation follows FK links from tank → batch → recipe to read the recipe's allowed temperature range. The link streams are themselves temporal, so historical evaluations use historically-correct recipes.hi input variable
SELECT recipe_fk, 'temp_max'
FROM batch
WHERE _component_uid = (
  SELECT batch_fk
  FROM tank
  WHERE _component_uid = @_component_uid
)
lo input variable
SELECT recipe_fk, 'temp_min'
FROM batch
WHERE _component_uid = (
  SELECT batch_fk
  FROM tank
  WHERE _component_uid = @_component_uid
)
Each input is a two-hop traversal: tank.batch_fk → batch._component_uid,
then batch.recipe_fk → the recipe component's temp_max or
temp_min stream. @_component_uid binds to the tank that owns the
derivation. The result column tells the engine which stream to read from the resolved component.
Inspect the Graph & Diagnose Live
Right-click any derived stream and choose Derived Stream Diagnostics to see its dependency graph and step through the live computation. Trace which inputs resolved to what values, where roll-ups were sourced, and how each stage produced its output — in real time, against real data.