GroveStreams Temperature Tutorial
This tutorial walks through:
- Modeling a temperature
component with a temperature stream and a voltage stream.
- Exploring the
temperature stream.
- Creating a dashboard.
- Detecting events and
sending notifications.
This tutorial follows the GroveStreams Electric Imp Feed PUT example which demonstrates how to upload temperature and voltage readings into GroveStreams. Although this tutorial follows the Electric Imp example, it can be used for any device that uploads data into GroveStreams.
1. Modeling a Temperature Component and Streams
The Electric Imp Example demonstrates how to push data into GroveStreams from an Electric Imp device. That example has data arrive into a default component with default streams. Creating components and streams with default settings will not be acceptable for most use cases. The GroveStreams Feed PUT APIs provide many ways to automatically create and set component and stream attributes the first time data is uploaded. The most common technique is to model a Component Template and then include its ID with every Feed PUT API call. That's the technique we'll use for this example.A component template can be modeled complete with streams and events and be used to create many components with the same features. A component template's ID can be included as part of a Feed PUT call and when it is, it tells GroveStreams to create a component based on the template if the component does not already exist.
Creating the Temperature Component Template
We will first create a component template with each stream associated with a Rollup Calendar and Units. GroveStreams created some units when the organization was created, but we need to create one more: a Voltage unit.

Log into your GroveStreams account, select your organization, and select the Tools tab on the left.
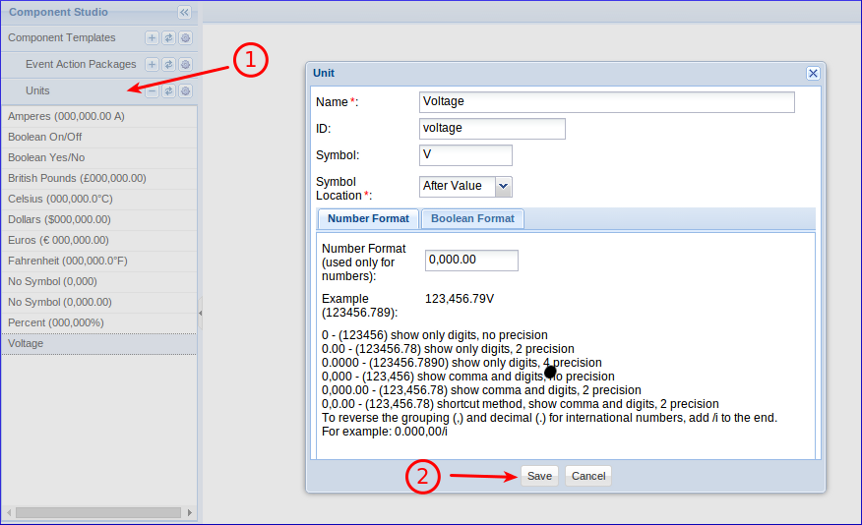
Create the Volt unit:
- Select the Units pane, right click within the Units folder
and choose New Unit. Fill in the fields with the settings
above.
- Click Save.
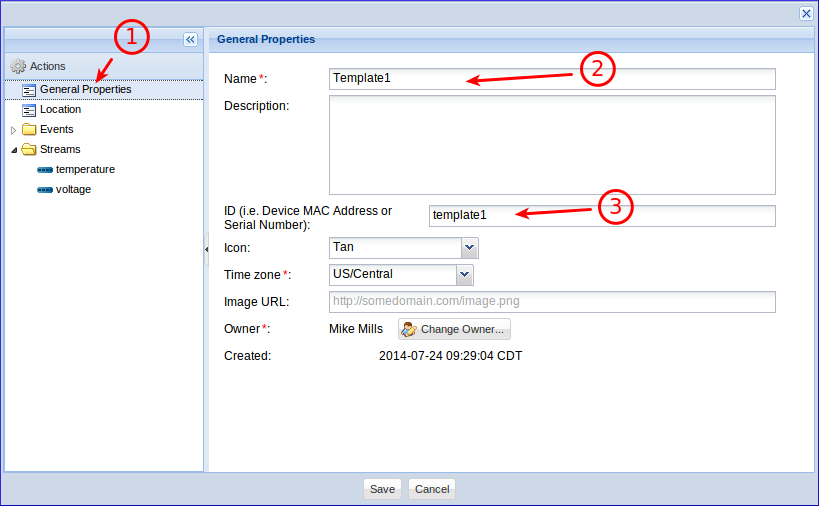
Create the Component Template:
- Select the Component Templates folder, right click on
a folder and choose New - New Component Template. Select General
Properties
- Enter a name for the template. It can be any name.
- Enter an ID. The ID will be used as part of the
Feed PUT.
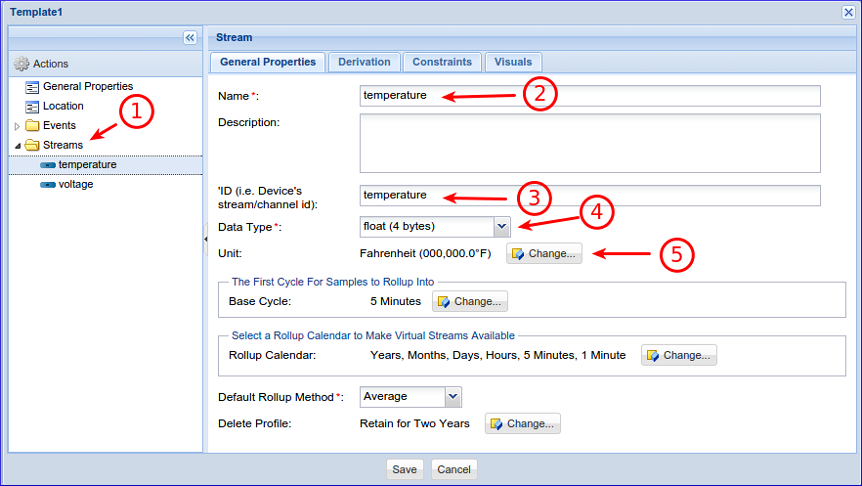
Create the Temperature Stream:
- Select Streams, right click and choose Add -
Stream - Stream. Select the General Properties
- Enter a name for the stream. It can be any name.
- Enter temperature for the ID. The ID will be used
as part of the Feed PUT.
- Select float data type.
- Select the Fahrenheit unit.
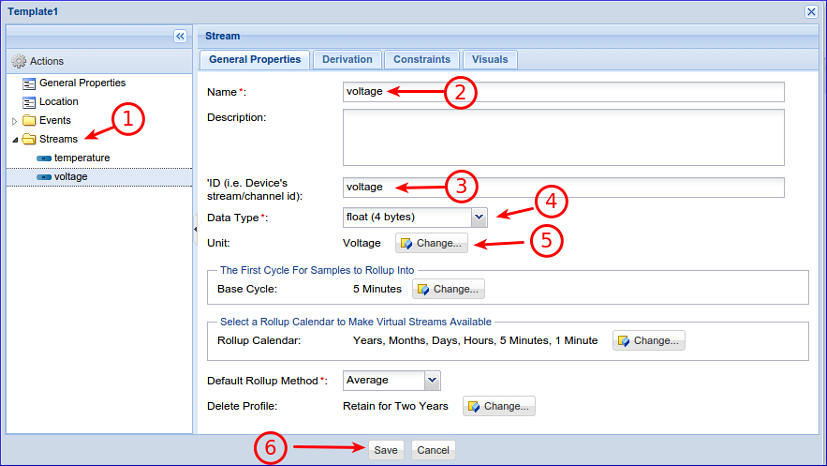
Create the Voltage Stream:
- Select Streams, right click and choose Add -
Stream - Stream. Select the General Properties
- Enter a name for the stream. It can be any name.
- Enter voltage for the ID. The ID will be used as
part of the Feed PUT.
- Select float data type.
- Select the Voltage unit that was created above.
- Click Save to save the new template.
Your organization will already contain a component with default streams if the Electric Imp Example has been run earlier. That component needs to be deleted so that a new component, based on the new template, will be created.
Delete the old component along with all of its stream data:
- Click the Observation Studio toolbar button.
- Expand the Components folder.
- If an old component exists, right click on it and choose Delete.

Modify the Electric Imp (or other device) Feed PUT URL to include the template ID:
- Open the Electric Imp IDE and un-comment the line that
includes the template id.
- Click Build and Run.
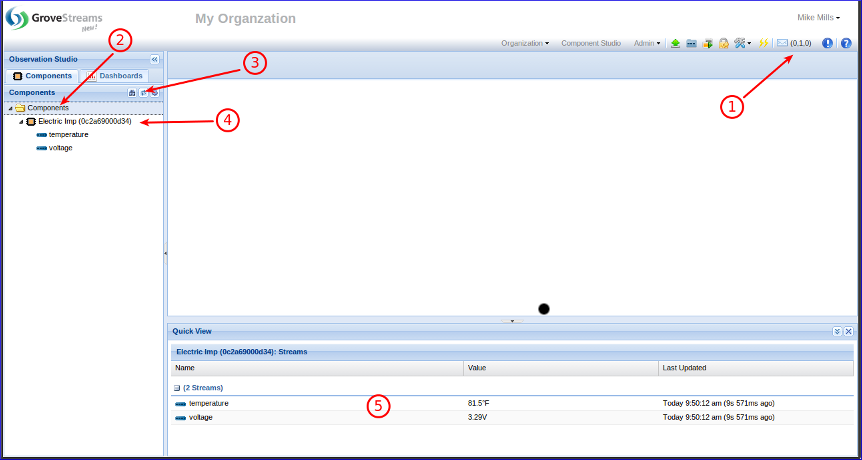
A new component, based on the template, will be created when the first Feed PUT arrives:
- A System notification will arrive stating that a new
component was created.
- Select the Components folder.
- Click Refresh.
- The new component will be listed. Select it.
- The new component's streams will be listed within Quick
View along with their latest values.
2. Exploring the Temperature Stream
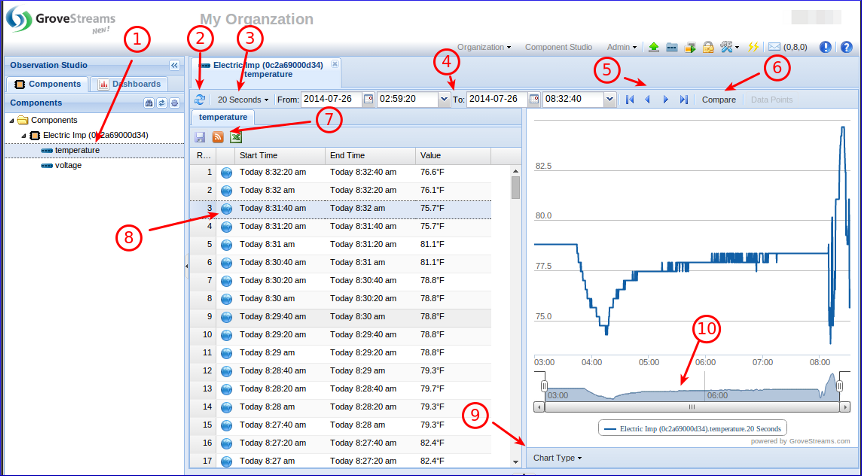
Explore the temperature stream:
- Double click the temperature stream to open Stream
Viewer and minimize the Quick Viewer located at the bottom.
- Click the Refresh button to view the latest
samples.
- View different Rollup Calendar Cycle intervals.
- View a different range of samples.
- Use the page buttons to navigate to the beginning or end
of the stream or to page forward or backward in time.
- Click Compare to include other streams within the
graph or drag and drop other streams onto the grid.
- Click Save to save any sample value changes. Click
the RSS feeds button to subscribe to this stream feed.
Click Export to export the stream data as a delimited text
file.
- Click the location icon to view the component's
location during a sample time.
- Click Chart Type to switch chart types.
- Use the stream navigator to navigate the current
selection of samples or drag your mouse within the graph ,while
the left mouse button is down, to zoom in.
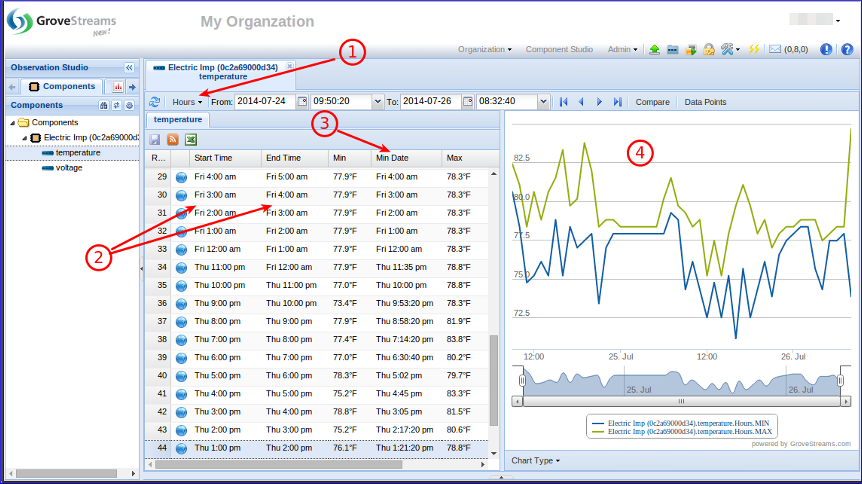
Viewing Rollup Calendar Cycle statistics:
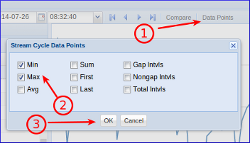
- Select the Hours cycle. Select the minimum and
maximum cycle statistics for the Hours cycle:
-
- Click Data Points.
- Select Min and Max.
- Click OK.
- Hourly minimum and maximum statistics and when each
occurred for each hour are now displayed. Note the start and end
time of each hour interval. The start datetime is inclusive. The
end datetime is exclusive.
- Hourly minimum and maximums within a graph.
Viewing a Rollup Calendar Cycle gap statistics:
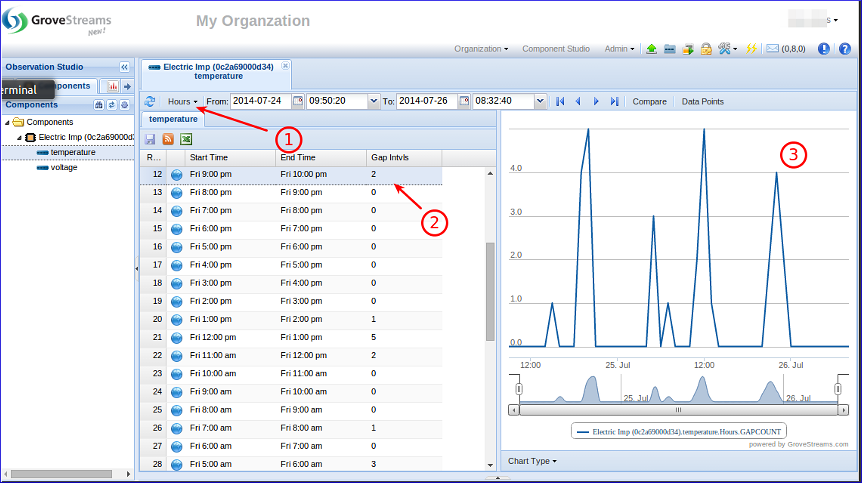
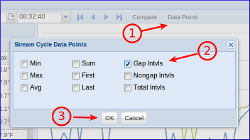
- Select the Hours cycle. Select Gap Intvls
for the Hours cycle:
-
- Click Data Points.
- Select only Gap Intvls.
- Click OK.
- The number of gaps for each hour.
- The number of gaps graphed.
3. Creating a Dashboard
Create a new dashboard:
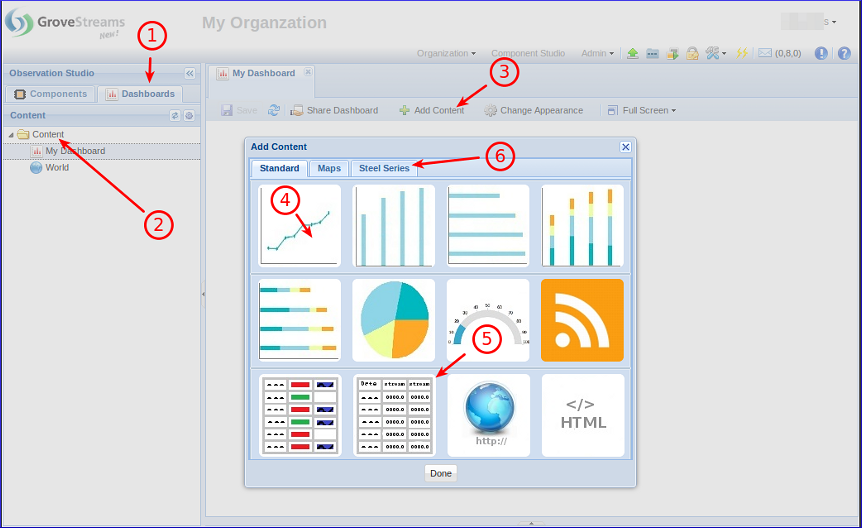
- Select the Dashboards navigation tab.
- Select the Content folder, right click and choose New
- Dashboard.
- Click Add Content.
- Click the Line Chart widget button to add a line
chart widget to the new dashboard.
- Click the Table View widget button to add a table
view widget to the new dashboard.
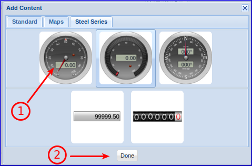
- Select the Steel Series tab:
-
- Click the Radial Gauge widget button to add a radial gauge widget to the new dashboard.
- Click Done to close the widget selection window.
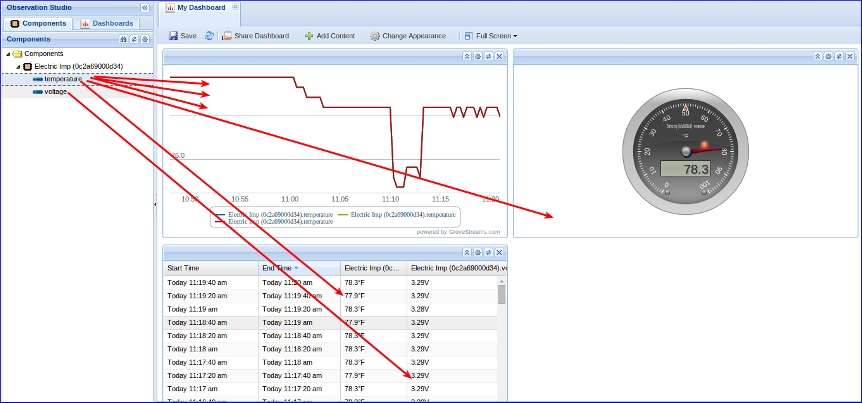
Add streams to the new widgets:
- Select the Components navigation tab.
- Drag and drop the temperature stream three
times onto the line graph widget.
- Drag and drop the temperature stream one
time onto the radial gauge widget.
- Drag and drop the temperature stream one
time onto the table view widget.
- Drag and drop the voltage stream one time
onto the table view widget.
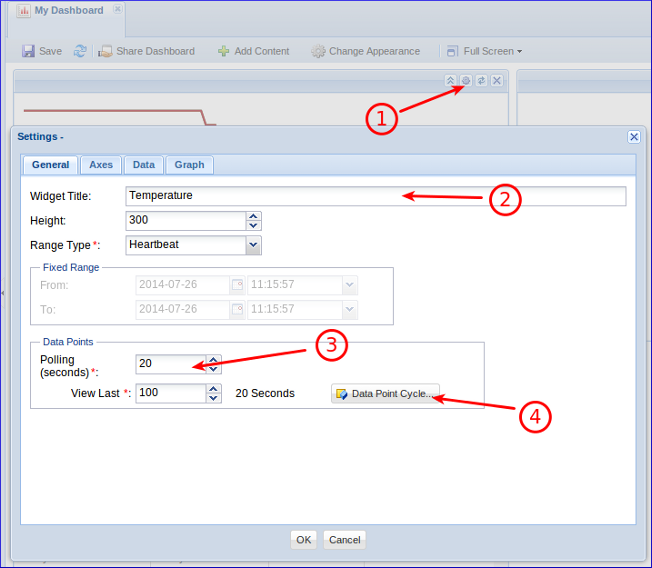
Edit the Line Graph widget:
- Click the line graph widget cog icon and select Settings.
- Enter a Widget Title. It can be any title.
- Enter 20 seconds for the Polling. This is how often
the widget will automatically refresh itself. Setting Polling
to zero indicates no polling. Widget
Polling will add to your GroveStreams monthly transaction costs.
A smaller polling value will result in higher transaction costs
(whenever a dashboard is left open for long periods).
- Select a 20 Second Data Point Cycle. This
configures the graph with vertical time tics representing 20
seconds. 20 seconds matches the stream sample frequency. You may
have to create a 20 second Cycle. If so, click the New
button within the Cycle selection window. The graph will now
display 2,000 seconds of samples since
100 samples, each 20 seconds each, will be displayed (100 * 20 =
2,000 seconds).

Three data series, each a stream, were added when the temperature stream was dragged and dropped onto the line graph widget threes times. Next we'll configure two of the series to report the Daily High and Daily Low of the current day along with the current temperature. Edit the line graph data series:
- Select the Data tab.
- Change each Display Name to the values above.
- Change the Cycle to the values above for rows two
and three.
- Change the Statistic to the values above for rows
two and three.
- Deselect Connect Gaps for all rows above. Not
connecting gaps will allow gaps to be visible within our line
graph.
- Click OK to close the line widget configuration
window.
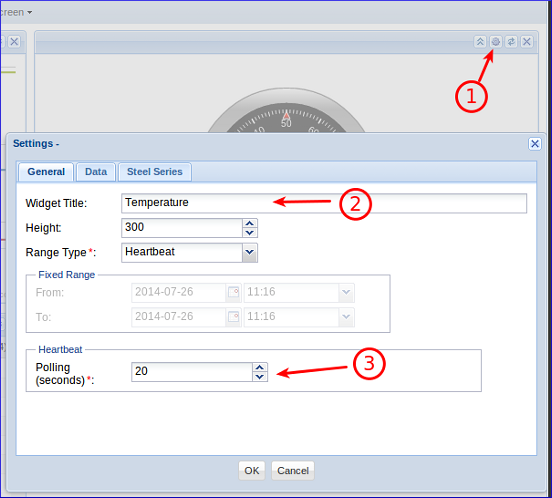
Edit the Radial Gauge widget:
- Click the radial gauge widget cog icon and select Settings.
- Enter a Widget Title. It can be any title.
- Enter 20 seconds for the Polling. This is
how often the widget will automatically refresh itself. Setting Polling
to zero indicates no polling.
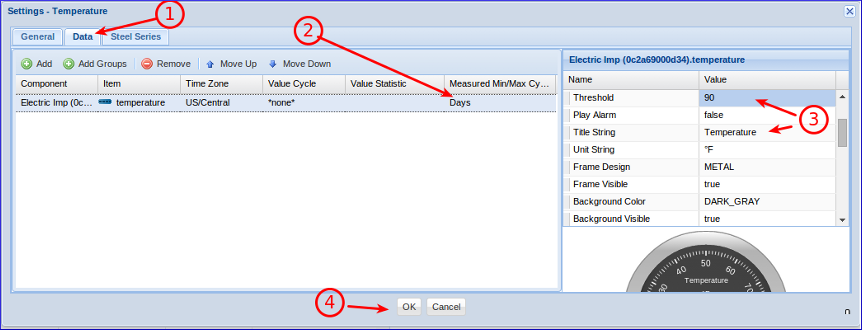
- Select the Data tab.
- Select the Days cycle for Measured Min/Max
Cycle. This will cause the daily high and low temperature markers
to appear within the radial gauge. These markers will change as
the daily high and low change throughout the day.
- Change the Threshold and Title String
values. The threshold setting is used to flash a red LED light on
the gauge whenever the threshold is exceeded. You may also enable
an audio alarm when the threshold is exceeded - just enable the Play
Alarm feature.
- Click OK to close the radial gauge configuration
window.
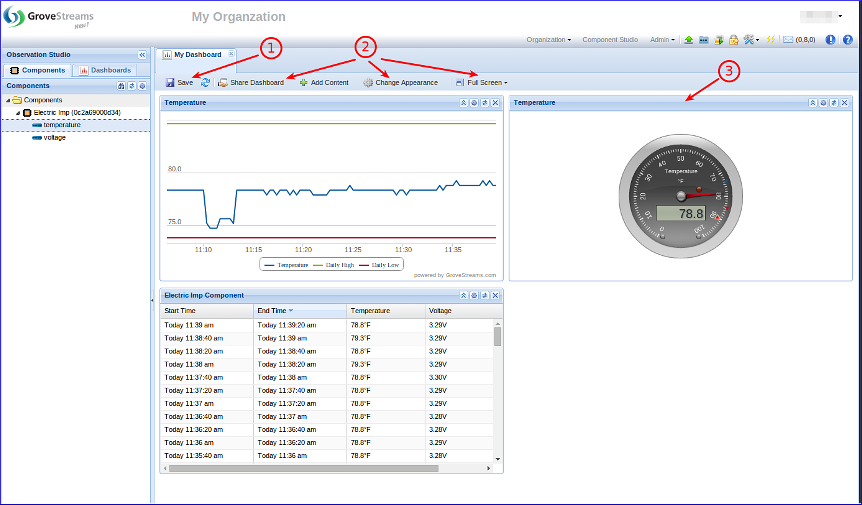
Congratulations! You have created a new dashboard:
- Click the Save button to save the changes that have
been made.
- Explore other dashboard options and capabilities.
- Widgets can be dragged and dropped to new positions.
- Click OK to close the radial gauge configuration
window.
4. Detecting Events and Sending Notifications
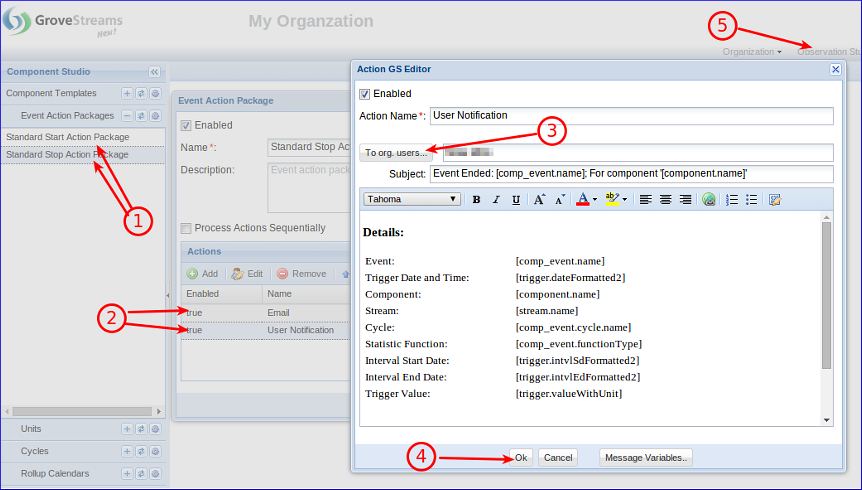
Both Start and Stop Action Packages listed need to be configured to send notifications to you. Each Action Package contains a set of actions to perform when an event starts or stops. Your organization already contains two pre-configured action packages. Edit each Action Package:
- Select the Tools tab on the left. Edit each Event
Action Package listed by double clicking one at a time.
- Edit each Action listed by double clicking one at a
time.
- Click To org. users... and select yourself for the
Email.
- Click OK to close the configuration window. Do the same for the
User Notification action.
- Click Save to save the changes for the Action
Package.
- Navigate back to Observation Studio after all
notifications have been configured.
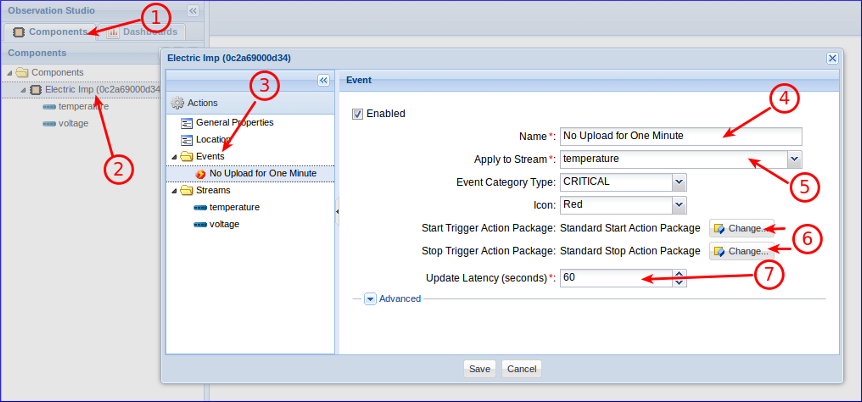
Create a Latency Event that will trigger when data for the temperature stream has not been uploaded for at least 60 seconds:
- Select the Components navigator tab.
- Right click on the component and select Edit
Component.
- Right click on the Events folder and select New
- Event - Latency Event.
- Give the event a Name. It can be any name.
- Set Apply to Stream to temperature.
- Set the Start and Stop Trigger Action Packages to
the ones above.
- Set the Update Latency to 60 seconds.
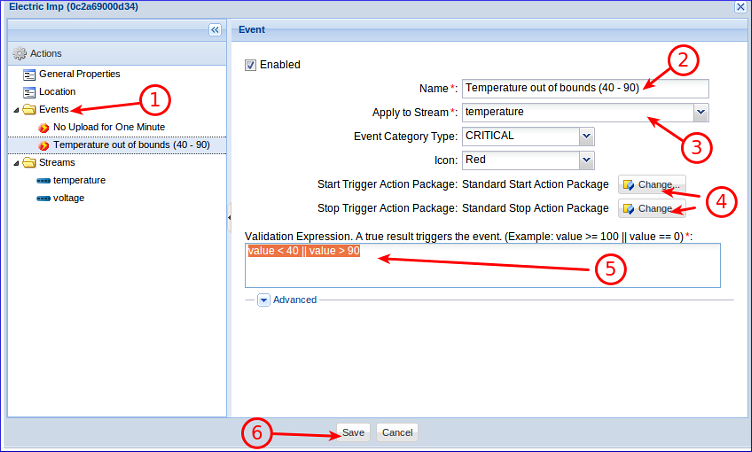
Create an Value Event that will trigger when a value is less than 40 or greater than 90 degrees:
- Right click on the Events folder and select New
- Event - Value Event.
- Give the event a Name. It can be any name.
- Set Apply to Stream to temperature.
- Set the Start and Stop Trigger Action Packages to
the ones above.
- Set the Validation Expression to value <
40 || value > 90.
- Click Save to save the changes to the component.
Trigger the value event: Take the temperature probe and force the temperature to increase to above 90 degrees. This can be done by holding the probe between two fingers.
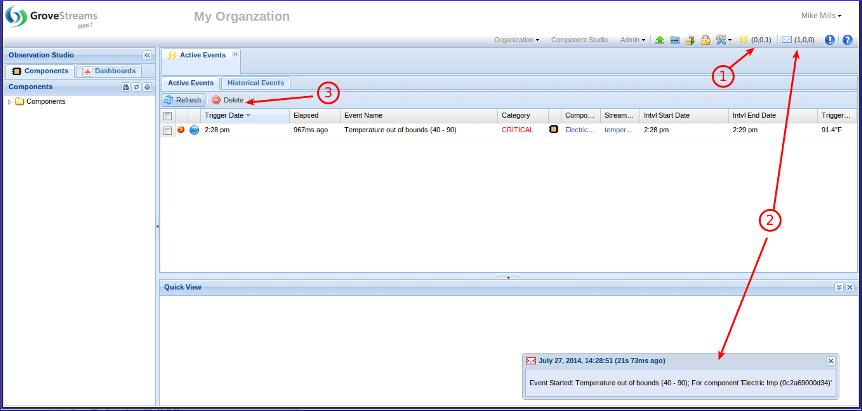
Viewing Active Events:
- The event button will list the number of active events
(INFO, WARN, CRITICAL). Click the button to view Active
Events.
- Event action package user notifications will also appear
as events start or stop.
- Events typically end on their own and are automatically
removed from the Active Events list. But sometimes events need to
be ended manually. Select one or more active events and click Delete
to remove an active event manually without triggering the stop
action package.
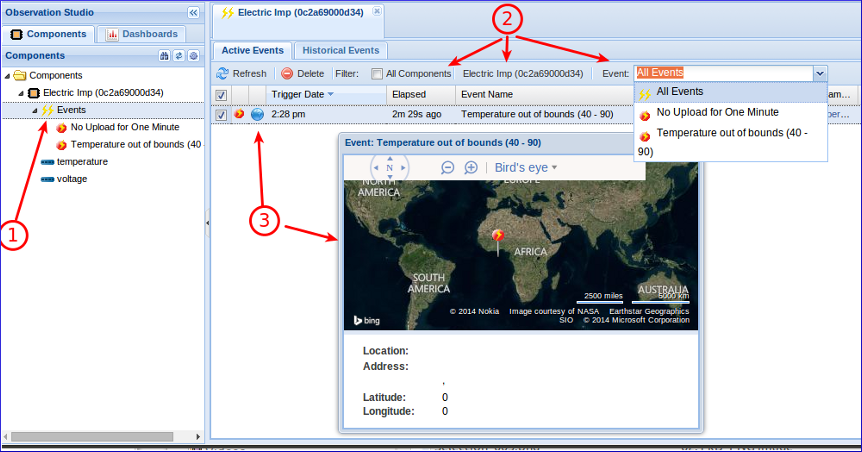
- Double click a component's Event group to bring up
the active events for a single component.
- Change several event filters to restrict which events are
listed.
- Click the Event Location icon to see where the
component was when the event started.
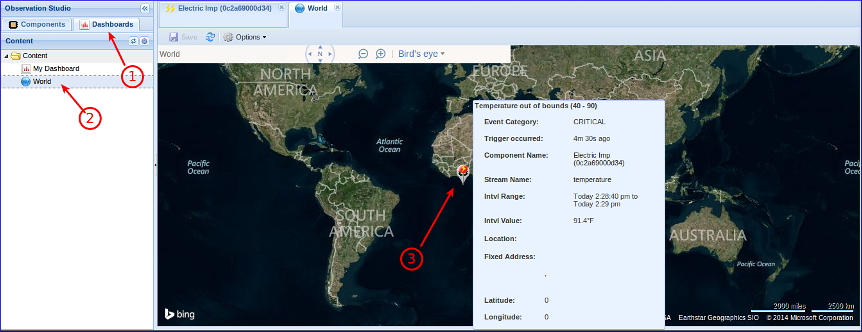
Active events will also be displayed within maps and dashboard map widgets:
- Click the Dashboards navigation tab.
- Double click the World map to open it.
- See the location of your components and any active events.
Hover over an event to see its details.

As each event ends (i.e. the temperature moves back into its normal range) its Stop Action Package will be executed. The above is a user notification that pops up when the event ended.
Helpful Links
GroveStreams Electric Imp Feed PUT exampleGroveStreams Help Center
GroveStreams Simple Feed PUT API
GroveStreams Forum
Electric Imp Forums
Electric Imp Docs
